A Quick Overview of the OMNeT++ IDE
Introduction
The OMNeT++ Integrated Development Environment is based on the Eclipse platform, and extends it with new editors, views, wizards, and additional functionality. OMNeT++ adds functionality for creating and configuring models (NED and ini files), performing batch executions, and analyzing simulation results, while Eclipse provides C++ editing, GIT integration, and other optional features (UML modeling, bugtracker integration, database access, etc.) via various open-source and commercial plug-ins.
The following screenshots introduce the main components of the OMNeT++ IDE.
 The OMNeT++ IDE, editing a NED file
The NED Editor
The NED Editor can edit NED files both graphically or in text mode, and the user can switch between the two modes at any time, using the tabs at the bottom of the editor window.
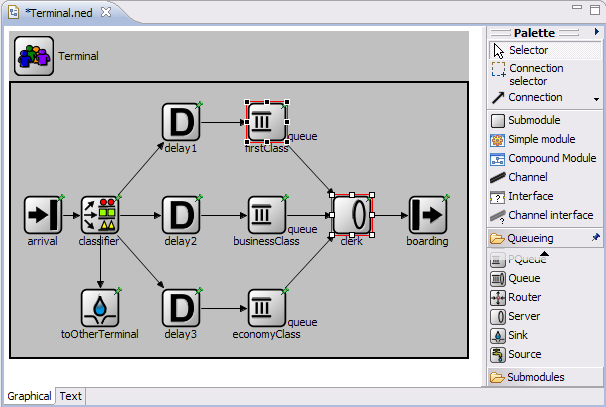 The NED Editor in graphical editing mode
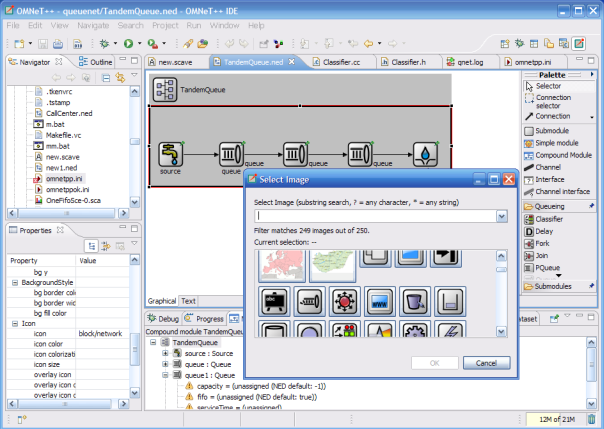
In graphical mode, one can create compound modules, channels, and other component types. Submodules can be created using the palette of available module types. Visual and non-visual properties can be modified in the Properties View, or by dialogs invoked from the context menu. The editor offers many features such as unlimited undo/redo, object cloning, constrained move and resize, alignment of objects, and zooming.
Submodules can be pinned (having a fixed position), or unpinned (auto-layout). Graphical features that can be edited are background image, background grid, default icons (via display string inheritance), icon sizing and coloring, transmission range, and many others.
 Properties view
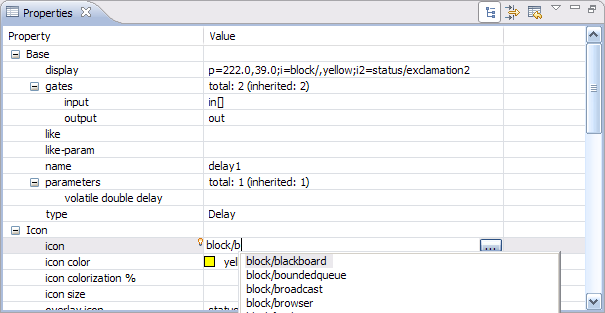
The Properties View lets the user edit graphical and non-graphical properties of objects. Special cell editors facilitate selecting colors, icons, etc. Undo and redo is supported for property changes too. The Properties View is also used with other editors like the Result Analysis editor, where it allows the user to customize charts and other objects.
 The NED Editor in source editing mode
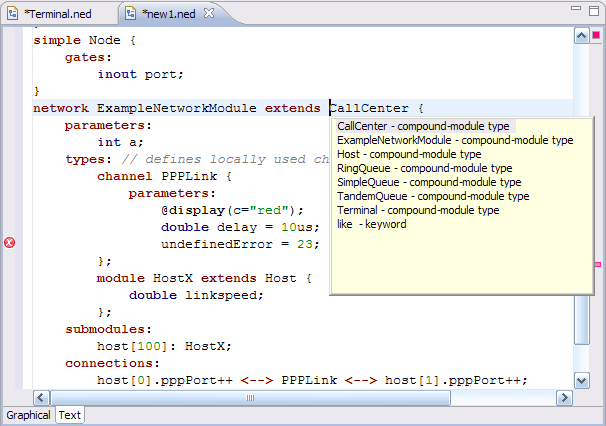
Text mode lets the user work with the NED source directly. When hitting Ctrl+Space, the editor offers context-aware completion of keywords and module type, parameter, gate, and submodule names. Template proposals to insert full compound module skeletons, submodules, various connection structures, etc. are also available. Documentation of referenced module types can be viewed by hovering over the NED type name. The NED source is continually parsed and validated as the user is typing, and errors are displayed in real time on the left margin. Syntax highlighting, automatic indentation, and automatic conversion from the OMNeT++ 3.x NED syntax are also provided.
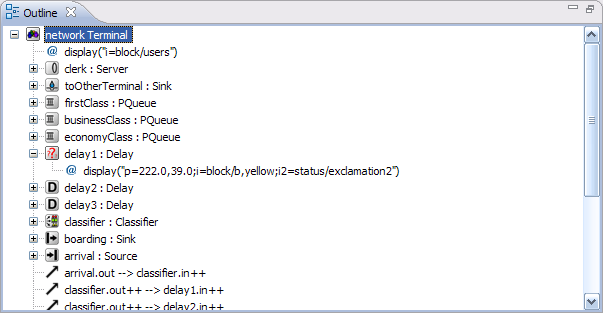 Outline View
The Outline View shows the structure of NED files in both graphical and text editing mode, and allows navigation, as well.
Other Views: The Module Hierarchy View and the NED Parameters View can also be used with the NED Editor (they will display the submodule hierarchy and the parameters of the selected module or submodule) – these views will be described with the Ini File Editor. Further related views are the Problems View (which displays errors and warnings in NED files and other files), and Tasks View (which shows a list of all FIXME and TODO comments found in NED files and other source files.)
The Ini File Editor
The Ini File Editor lets the user configure simulation models for execution. It features both form-based and source editing.
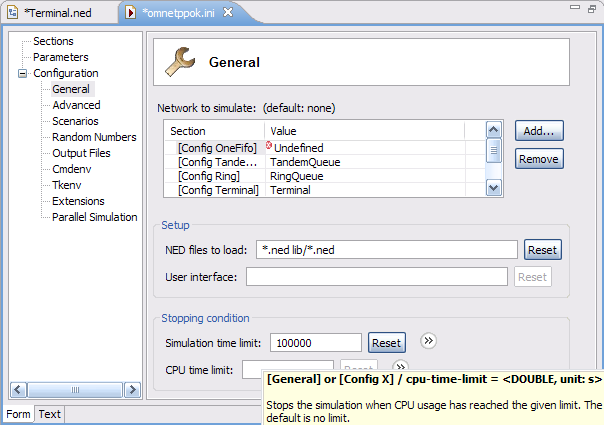 Form-based ini file editing
The Ini File editor considers all supported configuration options and offers them in several forms, organized by topics. Descriptions and default values are displayed in tooltips, which can be made persistent for easier reading. The structure of the ini file (sections and their inheritance tree) is also visualized and editable via drag&drop and dialogs. Validation and content assist (Ctrl+Space) are also provided where needed. The editor supports unlimited undo/redo and automatic conversion from OMNeT++ 3.x ini files.
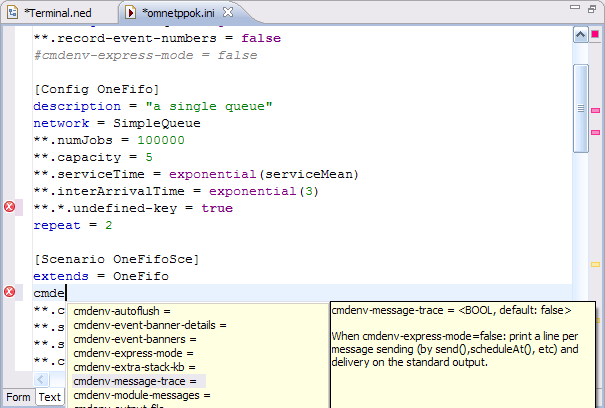 The ini file source editor
The text editor lets the user work with the ini file directly, which is more efficient for advanced users than forms. Unlimited undo/redo, syntax coloring, and completion of configuration keys, values, and module parameter patterns (on Ctrl+Space) are provided. As the user types, the file is continually analyzed and errors/warnings are displayed in real time.
The editor considers all NED declarations (simple modules, compound modules, channels, etc.) and can fully exploit this information to provide diagnostics and assistance to the user. Looking at the network= configuration key, it knows the top-level compound module NED type, and internally builds a static picture of the network by recursively enumerating the top-level module’s submodules, sub-submodules, sub-sub-submodules, etc., and continually relates this information to the ini file contents. Thus, the editor always knows which ini file keys match which module parameters, which are the ini file keys that are unused (will not match anything), and which module parameters are still open (i.e. have no value assigned yet). It displays this information in tooltips, as warnings, and in various views.
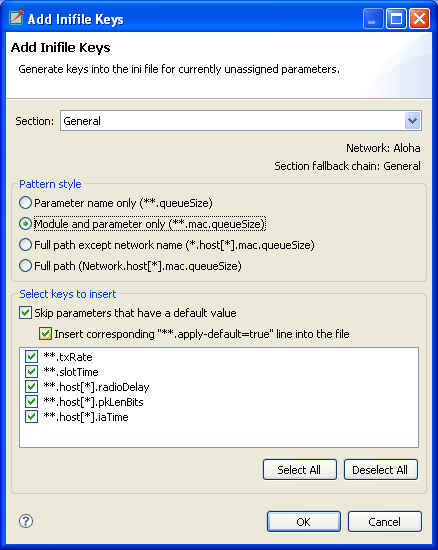 The Add Missing Keys dialog
To speed up the process of creating ini files from scratch, the editor offers an Add Missing Keys dialog. After clicking OK, the editor will insert ini file keys for all open NED parameters. The user will only need to supply the values.
 Module Hierarchy View
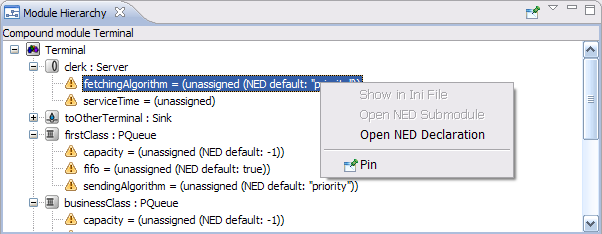
The Module Hierarchy View displays the submodule hierarchy of the current configuration’s network, together with the module’s parameters. It shows how module parameters obtain their values (from NED, by applying a NED default value, or from the ini file). It is able to resolve simple cases where a submodule type comes from a string parameter (NED’s like keyword). By using the context menu, the user can go to the NED declaration of a module, submodule, parameter, gate, or to the place where a parameter gets its value (in NED or in the ini file).
The View can be pinned to a particular editor to prevent its contents from changing when the user switches across NED and ini file editors.
 The NED Parameters View
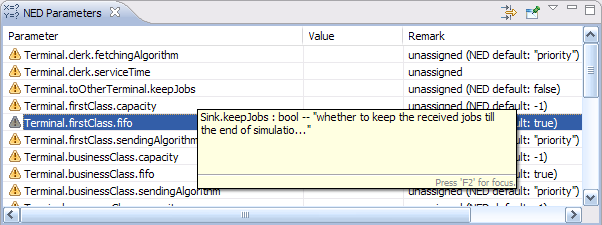
By default, the NED Parameters View displays the table of all unassigned NED parameters in the current configuration’s network and it can be switched over to show all parameters, assigned or unassigned. For assigned parameters, it shows how they obtain their values (from NED, by applying a NED default value, or from the ini file). The user can open the relevant places in the NED files or the ini file. This View can also be pinned.
 The Problems View
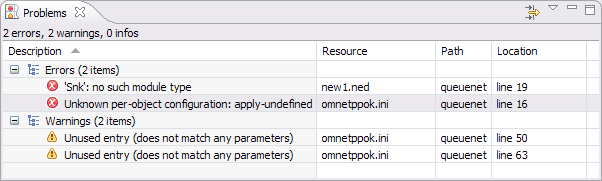
The Problems View presents errors, warnings, and info messages in NED files, ini files, and other source files in a unified manner. Double-clicking on an item opens the corresponding file and goes to the error’s location. The view’s contents can be filtered in various ways (current file, current project, all projects, by severity, etc).
Other Views: The Outline View displays the list of sections in the current ini file and can be used for navigation as well.
Simulation Launcher
The OMNeT++ IDE makes it possible to run simulations directly from the integrated environment. It is possible to run a simulation as a normal C/C++ application and perform C++ source-level debugging on it. The user can also run it as a standalone application (under Qtenv or Cmdenv) or run batches of simulations where runs differ in module parameter settings or random number seeds.
 The Run dialog showing a simulation launch configuration
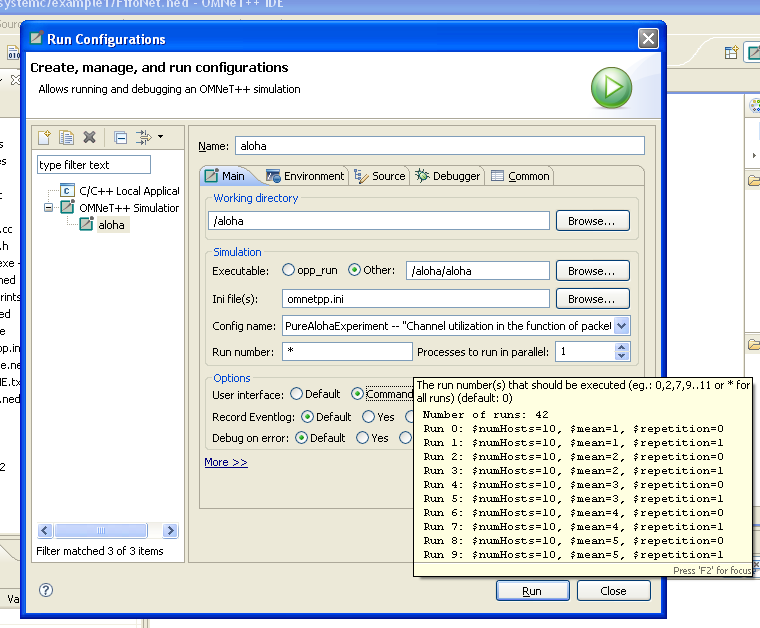
In the Eclipse IDE, the various ways of launching a program under development is described by launch configurations. There are various launch configuration types (C/C++ Application, Java Application, etc.). To launch a program for the first time, the user creates an instance of a launch configuration, fills in a form (program name, command-line arguments, etc.), and hits the Run button. OMNeT++ provides launch configuration types for simulations: one extends the normal “C/C++ Local Application” launch type with a Simulation tab (for convenient editing of simulation-related command-line options), and a standalone launch type for launching a simulation or running simulation batches. The former can be used for C++ debugging, as well.
The dialog shows a standalone launch type for the Aloha example simulation model. Batch simulations can be launched by specifying more than one run number in the dialog. Ini files allow the user to define various scenarios iterating over a list of values for certain NED parameters, and/or do multiple runs with different seeds. The launch dialog helps the user select the desired run numbers by showing which runs correspond to which parameters and seed settings.
Multi-processor or multi-core computers can be exploited by specifying that more than one process may be launched (i.e. may be running) at a time.
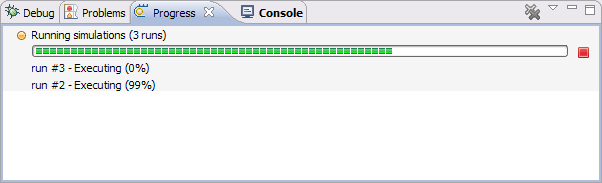 Progress View
The Progress View reports the status of simulation execution when you have a long-running simulation, or you are executing several runs in a batch. It is possible to cancel the whole batch operation with a single click, if necessary. Simulations run in separate processes that do not block the IDE, so users can keep working while their simulations run in the background. In the above screenshot, the number of processes to run in parallel was set to 2; run #1 has already terminated (and is no longer shown), run #3 has already launched, and run #2 is still running.
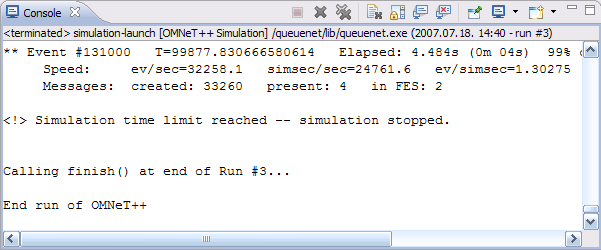 Console View
Each running process sends its output to a separate console buffer within the Console View, so the user can review the output after a simulation has finished. One can switch between console buffers using the Console View’s menu or toolbar, or by double-clicking on a process in the Debug View.
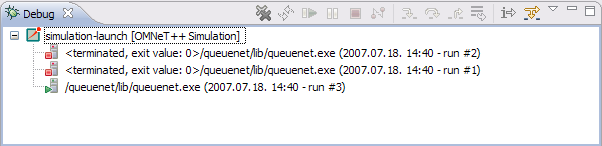 The Debug View showing three runs in a simulation batch
The Debug View is another one of Eclipse’s standard Views, but it is not only useful for debugging. While the Progress View only shows currently executing processes, the Debug View displays the ones already terminated, as well, together with their exit codes. Processes are marked with run numbers and launch times for easier identification. Double-clicking an item reveals the process output in the Console View.
Sequence Chart
The OMNeT++ simulation kernel is capable of logging various events during simulation: scheduling and canceling self-messages, sending messages, display changes, module and connection creation and deletion, user log messages, etc. The result is an event log file which contains detailed information of the simulation, and later can be used for various purposes, such as visualizing message exchanges among modules on a sequence chart. The file format is line-based text to facilitate processing by third party tools.
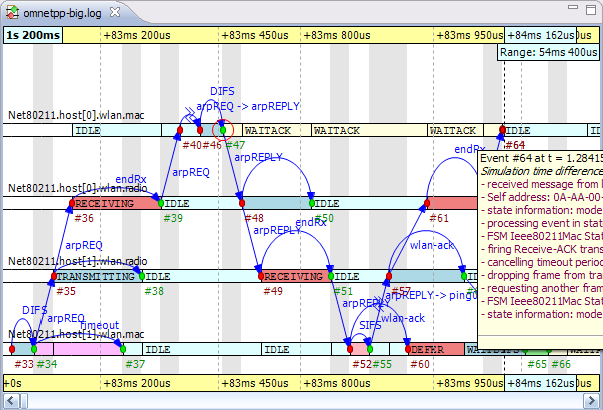 A Sequence Chart showing ARP on a wireless network
An event log can be visualized with the Sequence Chart in the IDE. On the Sequence Chart, events are represented as nodes, and message send/schedule/reuse operations as arrows. The chart can be filtered according to modules, message types, and various other criteria. The chart can also be filtered according to the causes/consequences of a particular event (this works by following message arrows backward and forward in simulation time). The chart timeline can be displayed in various modes, such as linear (simulation time), compact (non-linear), and event number-based. Other features include sorting of module axes, displaying state vector data on axes (using output vector files), zooming, and special navigation options (bookmarks, zoom to message send, follow message send), and exporting the chart in SVG format.
Both the Event Log Table and the Sequence Chart are capable of efficiently displaying event log files of several gigabytes without requiring large amounts of memory.
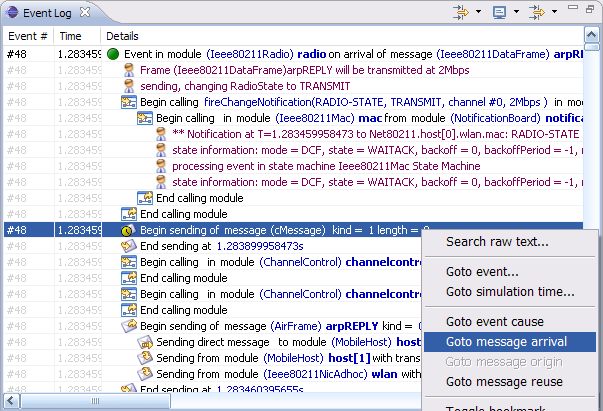 The Event Log View
The Event Log Table displays the content of an event log file recorded during a simulation. It supports raw and descriptive notations, line-based filtering for event log entry types and various parameters, search for free text, bookmarks, and special navigation options such as “go to simulation time” or message arrival. The Event Log Table supports the same filtering as the Sequence Chart.
Result Analysis
Simulations record their results into vector (for time series data) and scalar files (for scalars, histograms, statistical summaries, etc). These result files can be browsed and analyzed in the Python-powered Analysis Tool in the IDE. The Analysis Tool works equally well on the output of a single simulation run and the output from parameter studies or simulation batches which may be several hundred files, possibly in multiple directories.
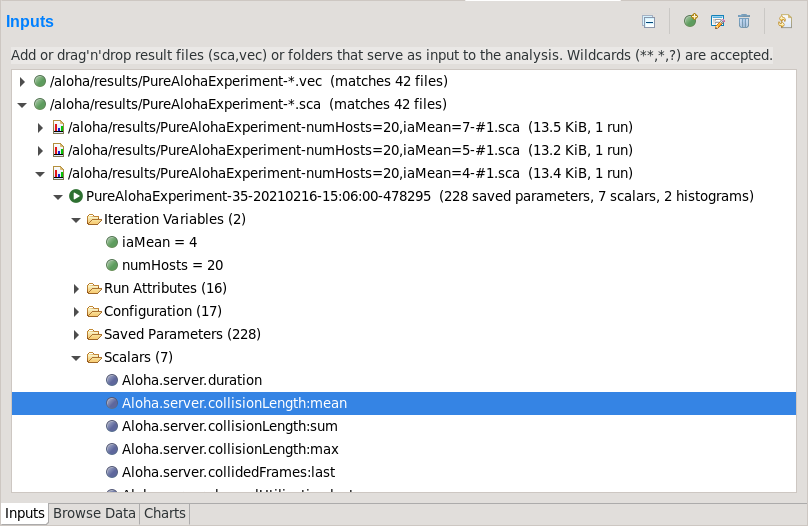 Specifying input files for data analysis
The first page in the editor is where the user can select input files for analysis. It lets the user edit a set of file name patterns or directory names that specify which result files to load. When the IDE expands the patterns, it displays the list of matched files under each one. The contents of files are also displayed in a tree structure.
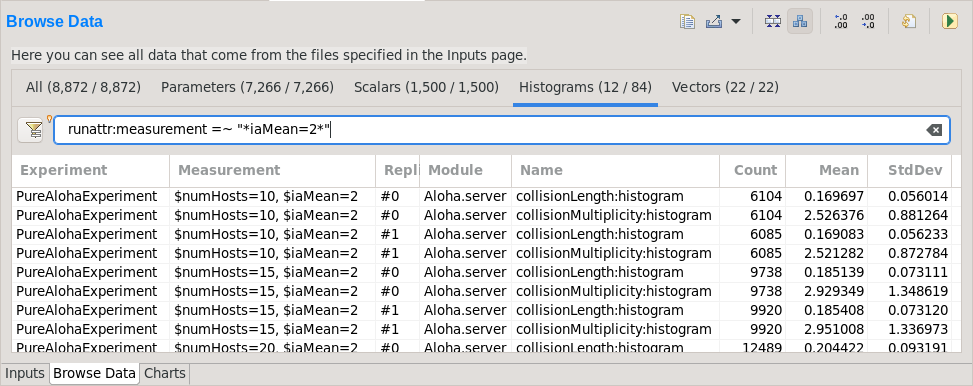 Browsing simulation results
The second page of the Analysis editor displays results (parameters, scalars, histograms, and vectors) from all files in tables and lets the user browse them. Results can be sorted and filtered. Simple filtering is possible with combo boxes, or when that is not enough, the user can write filter expressions in a generic pattern-matching expression language. Selected or filtered data can be immediately plotted.
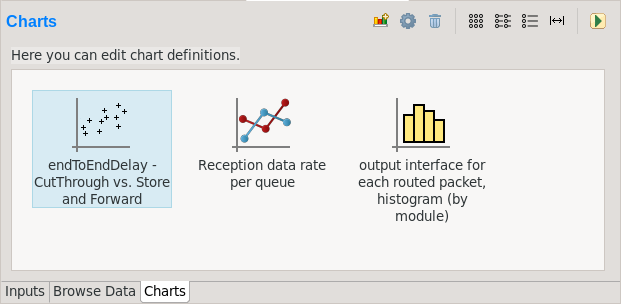 Managing charts in the analysis
The third page displays the charts created during the analysis as icons. Charts can be selected, reordered by dragging, copied, pasted, renamed, deleted, opened, etc.
New charts are selected from a Chart Gallery, which contains a set of pre-defined charts for the most frequent needs. Charts are backed by Python scripts, which use the Pandas DataFrame as the central data structure. The user can freely edit the script of a chart, and can also save the result into the Chart Gallery for reuse as a new chart type. Charts are configured by dialogs that let the user select the data to be plotted, item colors, line types, markers, axis titles and more. (These settings are stored as chart properties that the script can access and take into account.) Plots are drawn either with the Matplotlib library or using the built-in plotting capabilities of the IDE.
Since charts select their input from the result files using a filter expression, existing charts do not need to be re-created when the simulations are re-run – they will automatically update and display the new data.
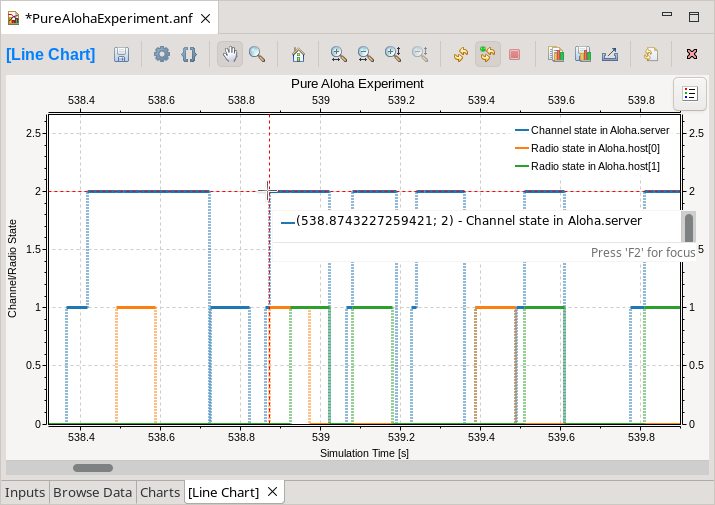 A Line Chart
Line charts are typically drawn from time series data stored in vector files. Pre-processing of the data is possible in the script. The line chart component can be configured freely to display the vector data according to your needs.
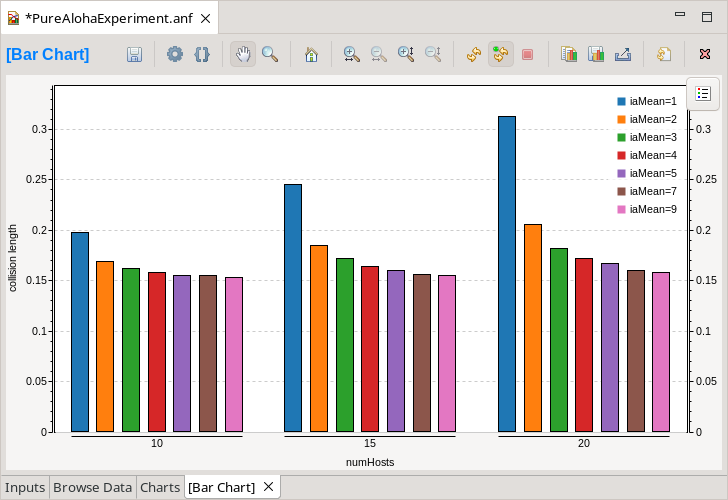 A Bar Chart
Bar charts are created from scalar results or scalar statistics of vectors or histograms. Relevant data can be grouped, and several display attributes can be set on the component.
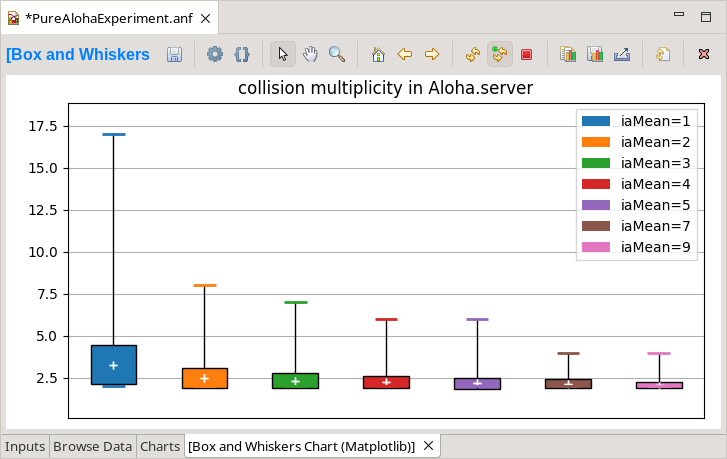 A Box and Whiskers Chart
This chart is just one example of the many types of charts that can be made using the integrated support for Matplotlib. It offers dozens of plot types out of the box, endless customizations, and proven high-quality output.
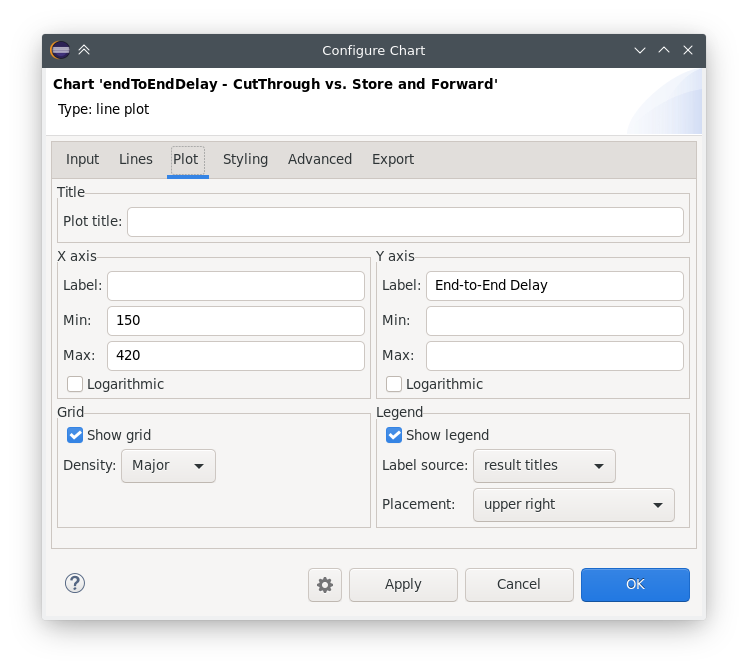 Chart Properties Dialog
Charts have a set of properties that define their behavior and looks. These properties can be edited in a configuration dialog. For many input fields, autocompletion and smart suggestions are available.
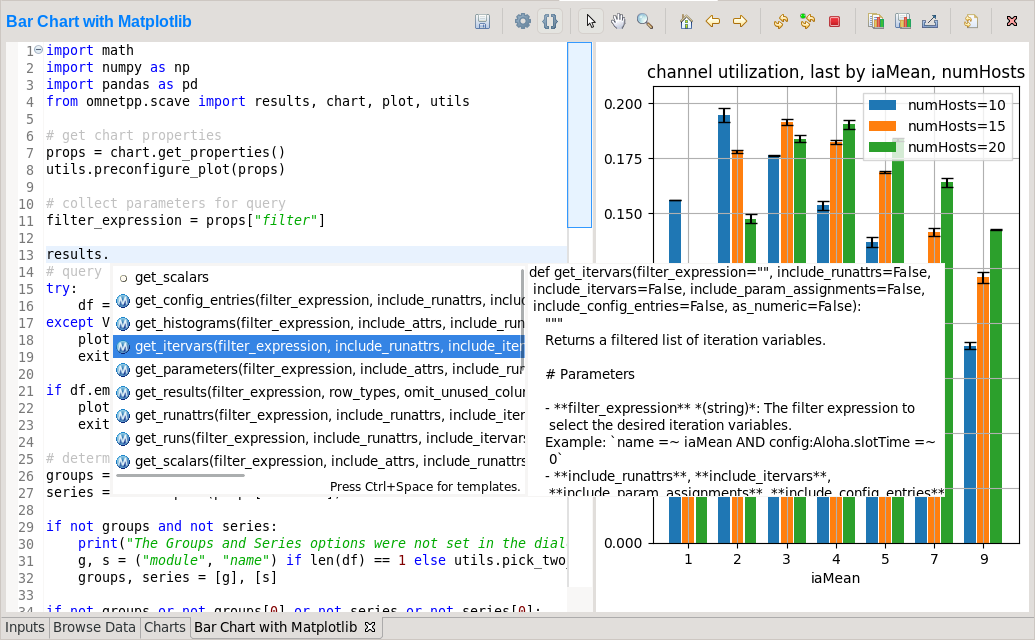 Chart Script Editor
With the embedded code editor, users are free to make any changes to the Python scripts powering each chart. The integrated editor is that of the PyDev project. It provides syntax highlighting, code navigation features, helpful tooltips, and code completion suggestions.
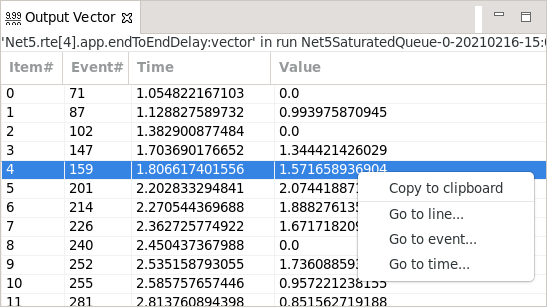 Output Vector View
The Output Vector View can be used to inspect the raw numerical data when required. The user can select a vector on the Browse Data Page, and its content will be displayed here.